Past & future radar
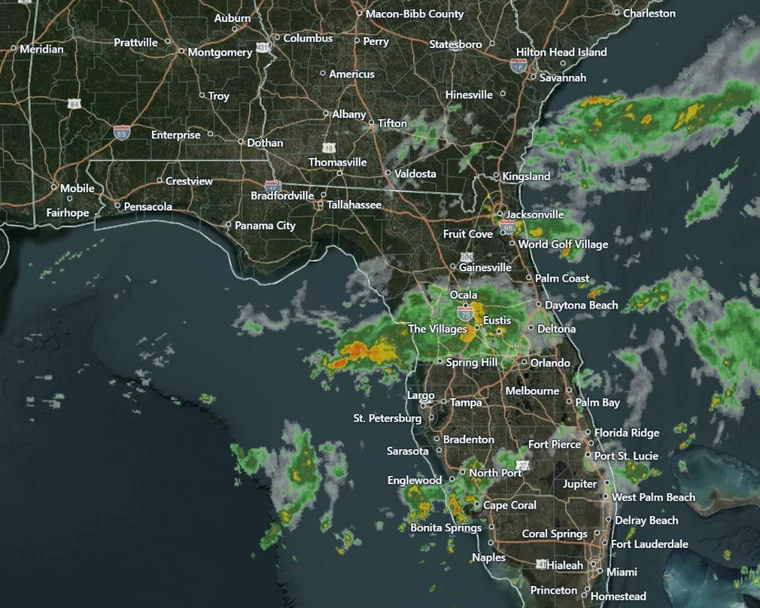 Observed radar
Review radar history and
simulated future radar.
AGRICULTURAL WEATHER & SATELLITE IMAGERY
Make field decisions with past and future radar, weather maps, forecasts, and satellite imagery in one place.
30 days free · No card required · Then $12/month
Observed radarReview radar history and
simulated future radar.
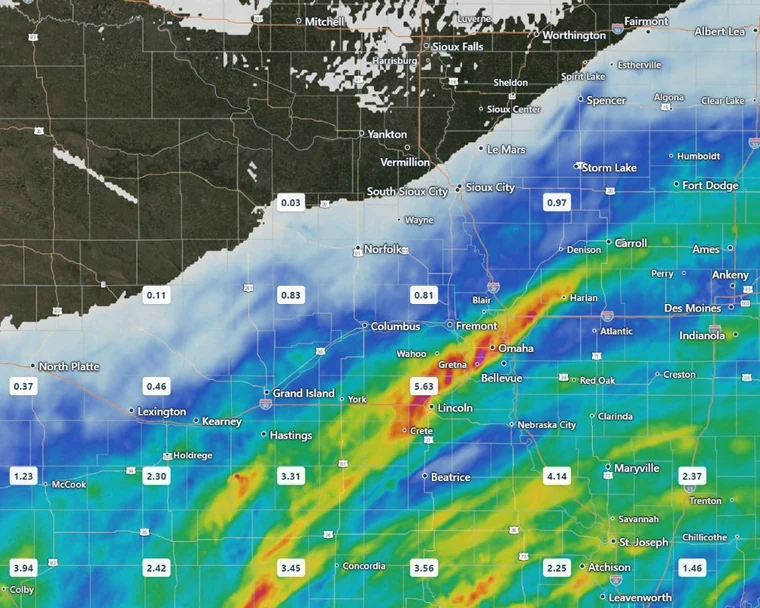 7-day rainfall
Past and future rainfall totals,
air conditions and soil temperatures.
Daily and hourly precipitation,
temperature, wind and gusts.
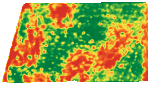
Natural-color and NDVI imagery
by field, date and season.
WEATHER MAPS
Explore past and forecast rainfall, temperature, wind, soil conditions and drought with your field boundaries in view.
Past rainfall totals, forecast precipitation, rainfall contours, snowfall and snow or ice guidance.
Recent, seasonal & custom periodsTemperature, feels-like temperature, humidity and wind. See the past, current readings and available forecasts.
Past, current & available forecast periodsShallow-soil temperature and moisture, dated drought maps, and soil-and-water views for your fields.
Modeled soil estimates · Top 0–4 inchesRADAR
Review observed radar history or available simulated future radar. Pause playback, select a time, and keep your fields in view.
Time ranges and coverage vary by layer and source. Future radar is a model forecast. Rainfall and soil values are estimates; dates and gaps remain visible in the app.
FORECASTS & CURRENT CONDITIONS
Temperature, rain totals, chance of rain, and wind gusts stay visible together in a compact forecast, along with humidity, dew point and corn growing degree days.
Select a day in the app for more detail, or review hourly conditions for your chosen location.
Fetched 7:01 AMOct 7, 2026
Saved app readings · ¹ Calculated sunrise and sunset
WSW 9 mph Gusts 16 mph
SSE 16 mph Gusts 25 mph
SSW 16 mph Gusts 25 mph
Three days from the app’s forecast, saved Oct 7, 2026.
SATELLITE IMAGERY
Review natural-color and NDVI imagery together. Use the same vegetation scale across fields to identify differences for closer inspection.
New passes are saved automatically when cloud cover over your field is below 30%.
Pick a year or date range and explore up to five years of available imagery as your archive fills.
Compare fields for the same period. Show the latest image or the one with the least cloud.
Sentinel-2 L2A · 10 m imagery · Fixed NDVI scale. Stronger contrast highlights differences in greenness without changing the measurements. Gray marks masked pixels. NDVI is not a yield estimate.
HISTORY & FIELD RECORDS
See when rain fell, how much your field received, and how the season compares with average. Choose your dates or follow totals since planting.
Daily rainfall, in inches0 = no recorded rain
Review individual days, or switch to rainfall bars and hourly detail in the app.
Saved app data · July 2026. Rainfall is estimated within the field boundary. Daily amounts are rounded; totals use full precision.
Recent periods, since planting, this year, last year or a custom range. Group records by hour, day, month or year.
Save boundaries, acreage, crops and planting dates. Compare rainfall and growing degree days with seasonal averages.
Calendars, rainfall bars, running totals and line graphs. Inspect measurements and coverage, then download rainfall tables or field boundaries.
THE COMPLETE TOOLKIT
Open a category to see the tools included, from field boundaries and rainfall records to forecasts and satellite history.
Weather and historical tools depend on source coverage for your location and dates. Daily historical snowfall and reference ET0 from the current NOAA soil feed are not available.
SIMPLE PRICING
Past and future radar, weather maps, forecasts, and satellite imagery. Access every tool across your phone, tablet, and computer.
Free trial. No card required.
Add a card during your trial if you want automatic renewal at $12/month when the trial ends. Or skip the card and subscribe later. Cancel before your first charge to avoid billing.
PRODUCT DETAILS
We automatically check for new Sentinel-2 passes and save qualifying images with less than 30% cloud cover over your field. Clear images depend on the satellite pass and the weather, so they will not be available every day. Each image shows its capture date and cloud percentage.
Yes. The app builds an archive covering up to the past five years. Older qualifying images are added as the archive fills. Select a year and date range to see what is available for each field. Some periods may have no image that meets the cloud and coverage checks.
NDVI uses red and near-infrared satellite measurements to show vegetation greenness. The same red-to-green scale is used across fields and dates. It can help you spot differences to investigate, but it does not diagnose a crop problem or predict yield.
If you choose automatic renewal and add a card during your trial, your $12 monthly subscription starts at the original trial end and renews until canceled. If you skip the card, trial access pauses until you choose to subscribe. There is no charge without your authorization.
Yes. An active plan includes unlimited saved fields. Draw boundaries or import them, then access your fields and account from your phone, tablet, or computer. Available weather, imagery, and historical records depend on source coverage.
MY FIELD WEATHER